Top Ten Update (14.02.21): Peru on top

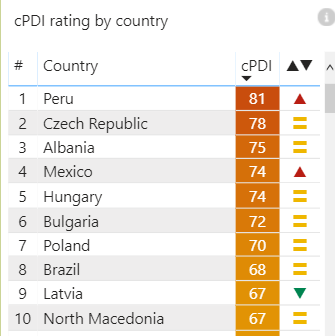
Welcome to our weekly Top Ten update, where we highlight the states most in danger from the pandemic right now. With pandemic numbers now receding in most of the world, the threshold for the top ten dropped from 69 to 67, but six of the former top ten states are still in danger this week, including our new #1 – Peru, where the index added five points to to rising incidence rates and a reproduction rate of 1.15. Two of the newcomers to the list are also Latin American countries which have been among the worst-hit so far – Brazil in 8th place and Mexico which climbed to 4th – but the rest of the list comes from Europe (mostly the Eastern and Balkan regions), including new additions Bulgaria and Northern Macdeonia.

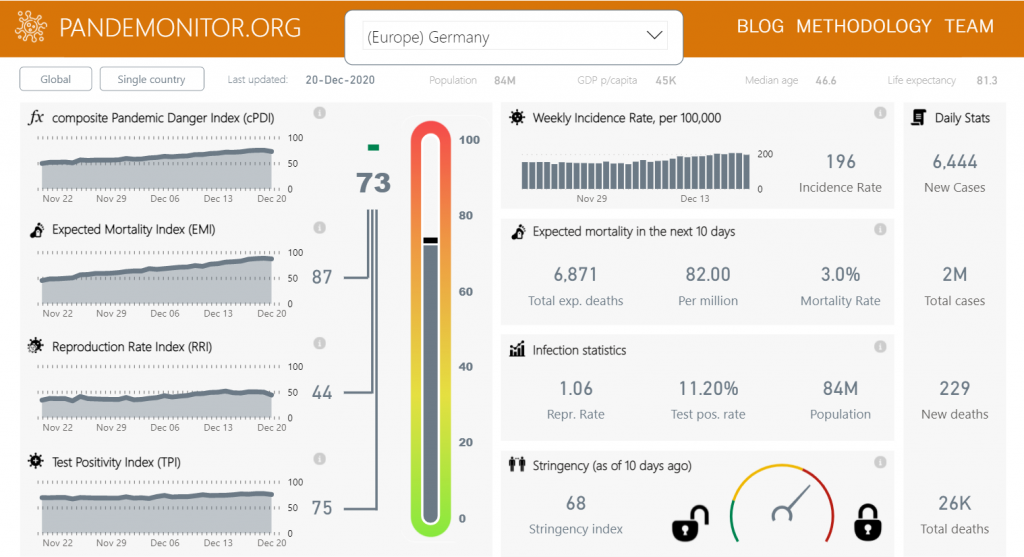
Conspicuously absent from the Top Ten are the United States, which dropped from 10th to 15th place as its cPDI plunged from 69 to 63, as well as the larger European states – Spain at 63 (tied for 15th), Italy at 57 (24th place), Germany and France at 53 (34-35th place) and the UK at 50 (40th place). We’ll soon see if this improvement trend holds.

Read more

Happy Holidays! (and some data analysis to boot)

As we wish our readers Merry Christmas and a happy 2021, we’d also like to note that the while holiday period might be festive, it’s also a bit problematic for us data collectors. Doctors’ offices close for the holidays, test centers reduce capacity and the system as a whole reports a smaller percentage of the new pandemic cases actually occurring in the population. This makes it hard to tell the signal from the noise, i.e. to decide whether a specific drop in case numbers is real, or is only an effect of the holiday season. This difference in interpretation could be critical in several European states, which are anxiously awaiting the results of newly-instated lockdowns and control measures.

To answer this question, we employed a comparative approach. To do so, we compared the weekly incidence rate [calculated in the Pandemonitor dashboard as the number of weekly cases per 100,000 inhabitants] on holiday week (the week ending on 31/12) and on the week before (the one ending on 23/12). We made the comparison for 44 predominantly Christian countries around the world (leaving out a few minor countries as well as place where data is suspect).


Read more

The German wave (or: how I learned to trust the model)

In late October, as Europe experienced a relentless second wave of COVID-19 infections, nations responded with several versions of a partial or full lockdown. Unlike the first wave in March, European nations diverged in the severity of their reactions – from a full lockdown in the Czech Republic to a much more relaxed ‘partial lockdown’ in Germany. Within a few weeks it became apparent that these difference in policy also had different results: While most European nations reached a peak in the weekly incidence rate and than saw a significant decline, some – most notably Germany – only managed to reach a plateau, with new infections remaining on the same level, give or take, testifying to a reproduction rate of just about 1. This steady states lasted for almost a month, before infections suddenly picked up again in early December , prompting a relatively strict lockdown in Germany from the 16th.

While Germany was in this steady state, I expected Germany to remain at about the same cPDI (composite Pandemic Danger Index). This, however, was not the case: starting from mid-November, Germany’s cPDI rose steadily, climbing from a not-so-bad 50 on Nov 20th to the mid-60s in early December and up to an alarming 75 (on the verge of our top ten!) on Dec 19th. This result surprised, so I decided to dig a little deeper.


Read more