In late October, as Europe experienced a relentless second wave of COVID-19 infections, nations responded with several versions of a partial or full lockdown. Unlike the first wave in March, European nations diverged in the severity of their reactions – from a full lockdown in the Czech Republic to a much more relaxed ‘partial lockdown’ in Germany. Within a few weeks it became apparent that these difference in policy also had different results: While most European nations reached a peak in the weekly incidence rate and than saw a significant decline, some – most notably Germany – only managed to reach a plateau, with new infections remaining on the same level, give or take, testifying to a reproduction rate of just about 1. This steady states lasted for almost a month, before infections suddenly picked up again in early December , prompting a relatively strict lockdown in Germany from the 16th.
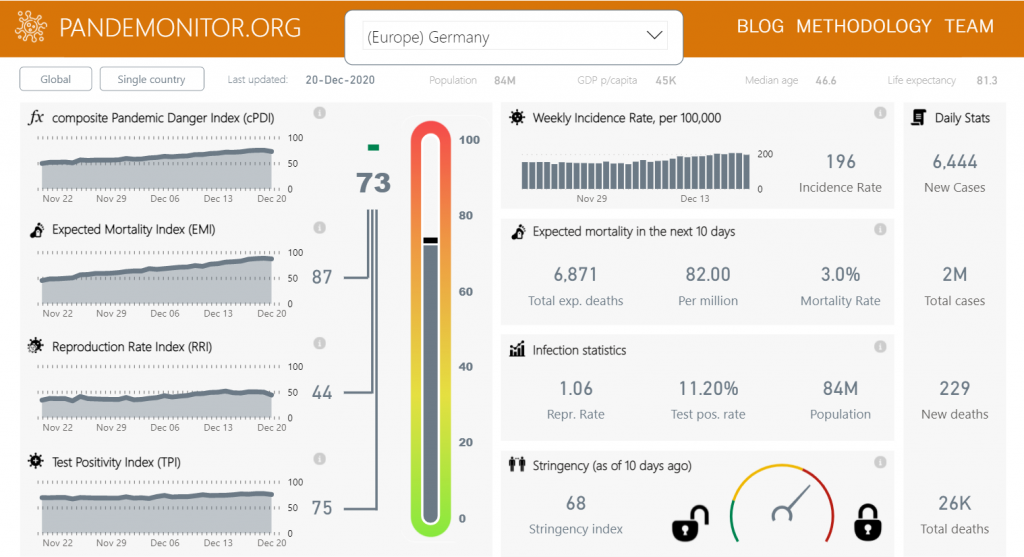
While Germany was in this steady state, I expected Germany to remain at about the same cPDI (composite Pandemic Danger Index). This, however, was not the case: starting from mid-November, Germany’s cPDI rose steadily, climbing from a not-so-bad 50 on Nov 20th to the mid-60s in early December and up to an alarming 75 (on the verge of our top ten!) on Dec 19th. This result surprised, so I decided to dig a little deeper.